The Operator Failure Rates reports works in the same way as the Plate Failure Rates report, except it allows you to narrow down the plates by an individual operator and their role. The report will show how each plate is performing over a period of time with a specific user using the plate.
1. From the Room Menu select Operator Failure Rates.
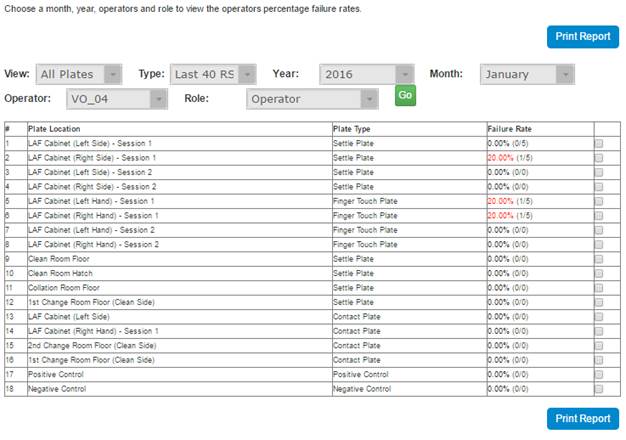
2. From the top of the Operator Failure Rates, use the drop downs to select the View (All Plates or Groups), Type (Last 40 RS or Range), Operator (The initials of the Operator to find) and the Role (Operator or Server). Use the Year and Month or Start and End pickers to choose the period of time to report on. Once the selection has been made click the Go button.
N.B. The last 40 RS will look for 40 Results Sets (Dates where data exists) from the end of the selected month.
The failure rate colours use a RAG scheme. Black: < 2.50%; Green: >= 2.50 & < 5.00%; Amber: >= 5.00% && < 7.50%; Red: >= 7.50%. The number in brackets show the number of failure plates / total number of plates.
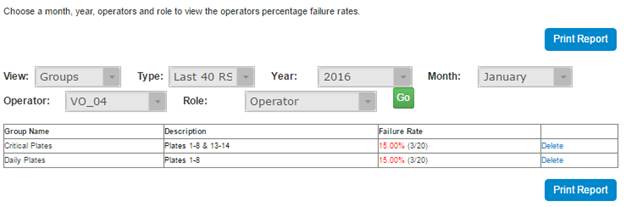
3. Changing the view to Groups and clicking Go will show you all of the Plate Groups (As defined in your Plate Group Manager). Holding your mouse over the description will show you all the plates included.
4. The Report can be Printed by clicking the Print Report button.