The Room Overview shows you had your plates are performing over a period of time, and also the previous 12 months. You can also narrow down your results by using Plate Groups.
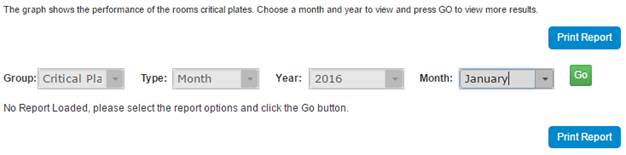
1. From the Room Menu select Room Overview
2. From the top of the Room Overview, use the drop downs to select the Plate Group (As defined in your Plate Group Manager) and Type (Month or Range). Use the Year and Month or Start and End pickers to choose the period of time to report on. Once the selection has been made click the Go button.
3. The report will load. The pie chart on the left shows the breakdown of plates with growths vs no growths, the pie chart on the right shows the breakdown of growths by their type. The line chat at the bottom shows the percentage failure of the room, month by month over the last 12 months.
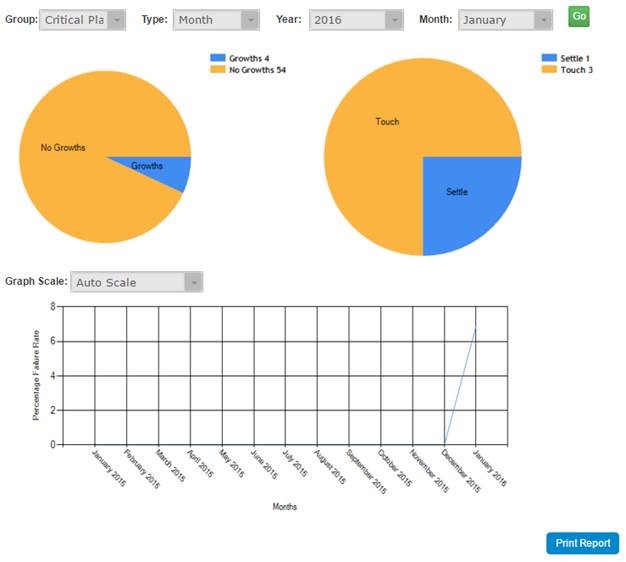
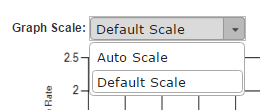
4. You can change to scale of the line chart from auto to default using the Graph Scale drop down. After changing the scale, the report will automatically re-load. Using the default scale is useful for comparing rooms side by side.
5. The Report can be Printed by clicking the Print Report button.